Plot Detector Geometry
In this example we will make a few simple plots of the geometry of a detector object, handy for presentations or for visualizing your work. This code can be run from the plot_detector.py script in the examples directory.
import numpy as np
import matplotlib.pyplot as plt
from mpl_toolkits.mplot3d import Axes3D
import pyrex
import pyrex.custom.ara as ara

# First we need to initialize the detector object and build its antennas.
# For this example we'll just use the original ARA geometry.
detector = ara.HexagonalGrid(stations=37, station_type=ara.RegularStation,
                             antennas_per_string=4,
                             antenna_separation=[2, 18, 2])
# Since we won't be doing any event simulation, the arguments of the antennas
# (threshold and noise) are largely unimportant
detector.build_antennas(power_threshold=0, noisy=False)

# Let's also define a function which will highlight certain antennas in red.
# This one will highlight all Hpol antennas.
def highlight(antenna):
    return isinstance(antenna, ara.HpolAntenna)

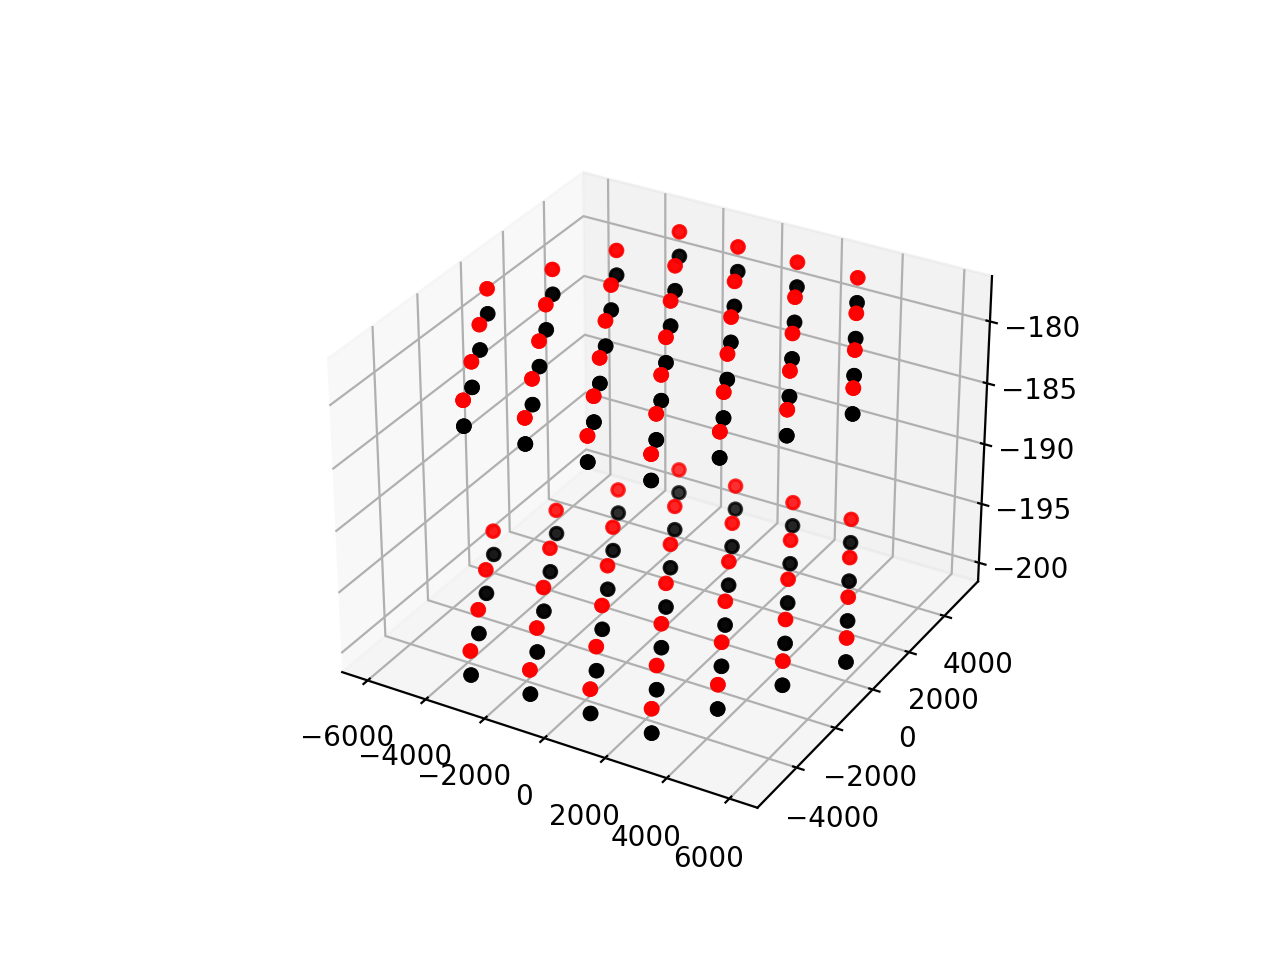
# For our first plot, let's make a 3-D image of the whole detector.
fig = plt.figure()
ax = fig.add_subplot(111, projection='3d')

# Plot the antennas which satisfy the highlight condition in red
xs = [ant.position[0] for ant in detector if highlight(ant)]
ys = [ant.position[1] for ant in detector if highlight(ant)]
zs = [ant.position[2] for ant in detector if highlight(ant)]
ax.scatter(xs, ys, zs, c="r")

# Plot the other antennas in black
xs = [ant.position[0] for ant in detector if not highlight(ant)]
ys = [ant.position[1] for ant in detector if not highlight(ant)]
zs = [ant.position[2] for ant in detector if not highlight(ant)]
ax.scatter(xs, ys, zs, c="k")

plt.show()

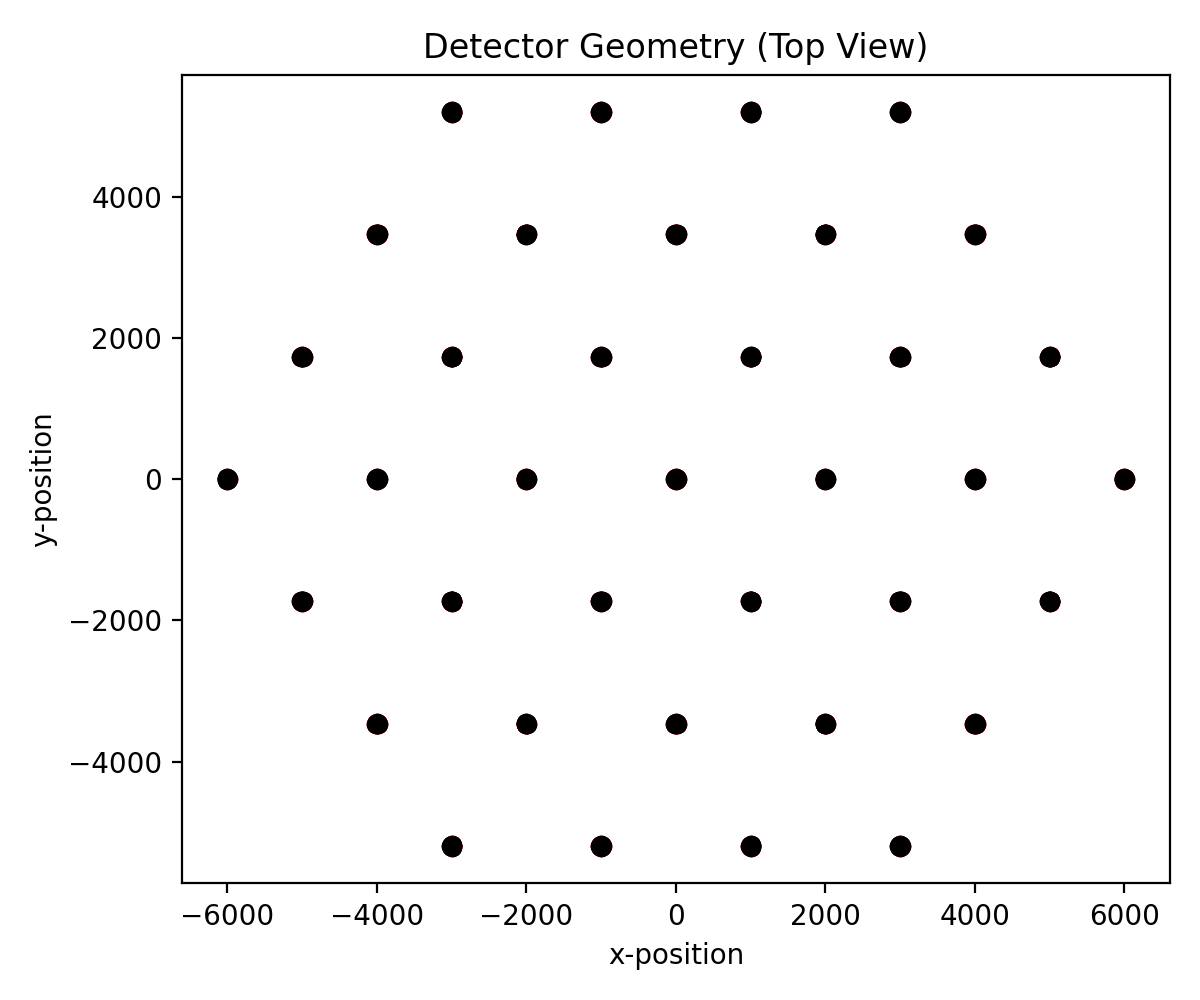
# Now let's plot the detector in a couple different 2-D angles.
# First, a top-down view of the entire detector.
plt.figure(figsize=(6, 5))

xs = [ant.position[0] for ant in detector if highlight(ant)]
ys = [ant.position[1] for ant in detector if highlight(ant)]
plt.scatter(xs, ys, c="r")

xs = [ant.position[0] for ant in detector if not highlight(ant)]
ys = [ant.position[1] for ant in detector if not highlight(ant)]
plt.scatter(xs, ys, c="k")

plt.title("Detector Geometry (Top View)")
plt.xlabel("x-position")
plt.ylabel("y-position")
plt.tight_layout()
plt.show()

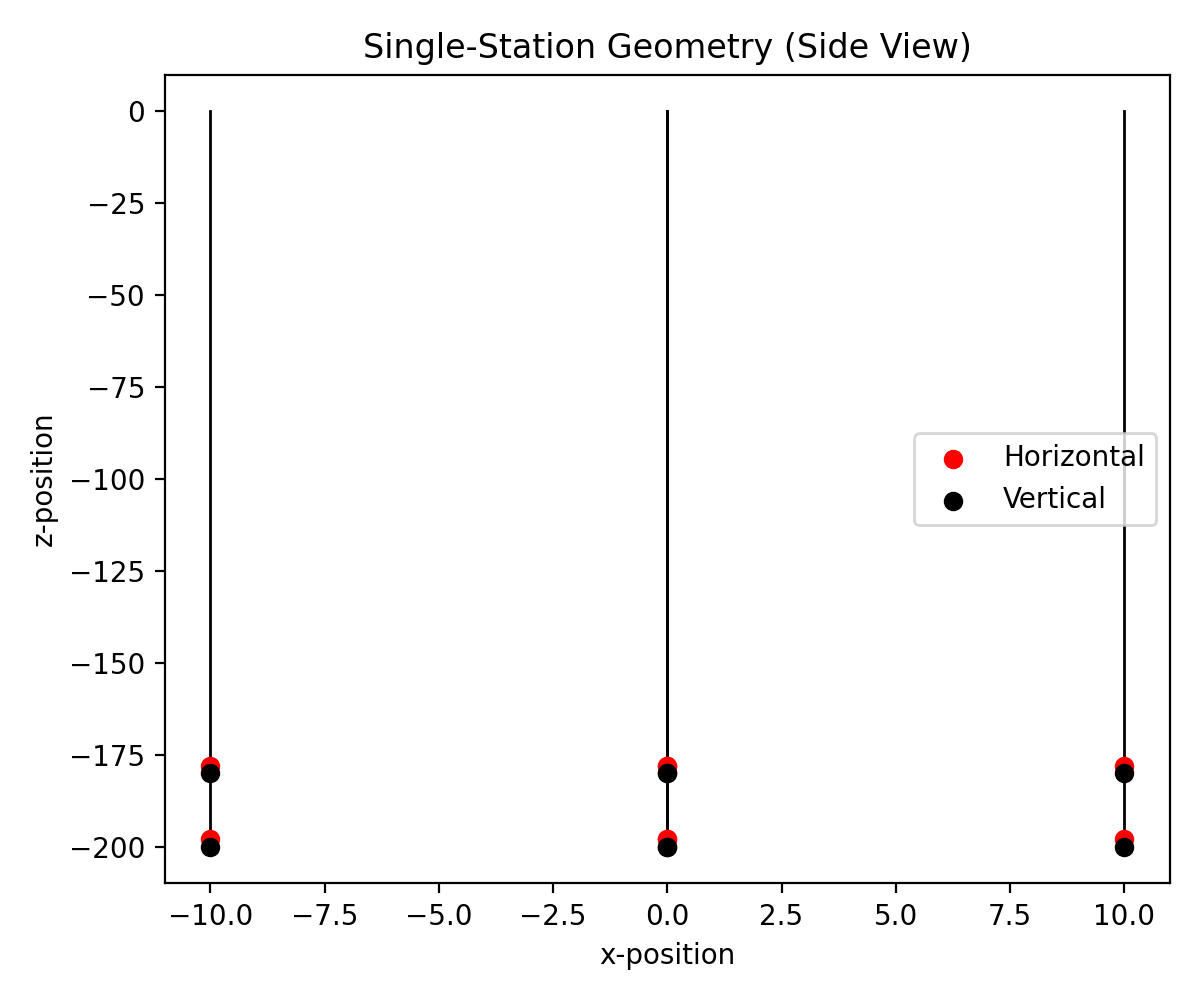
# Next, let's take an x-z view of a single station. Let's also add in some
# string graphics by drawing lines from bottom antennas to the top of the ice.
plt.figure(figsize=(6, 5))

station = detector.subsets[0]
for string in station.subsets:
    lowest_antenna = sorted(string.subsets,
                            key=lambda ant: ant.position[2])[0]
    plt.plot([lowest_antenna.position[0], lowest_antenna.position[0]],
                [lowest_antenna.position[2], 0], c="k", lw=1, zorder=-1)

xs = [ant.position[0] for ant in station if highlight(ant)]
zs = [ant.position[2] for ant in station if highlight(ant)]
plt.scatter(xs, zs, c="r", label="Horizontal")

xs = [ant.position[0] for ant in station if not highlight(ant)]
zs = [ant.position[2] for ant in station if not highlight(ant)]
plt.scatter(xs, zs, c="k", label="Vertical")

plt.title("Single-Station Geometry (Side View)")
plt.xlabel("x-position")
plt.ylabel("z-position")
plt.legend()
plt.tight_layout()
plt.show()


